Nine analyses. Nine models that run. Six markets. Central-bank and supervisor references, dated. All of them stop at PBT.
Every product has a metric management watchesthat does not move the result.
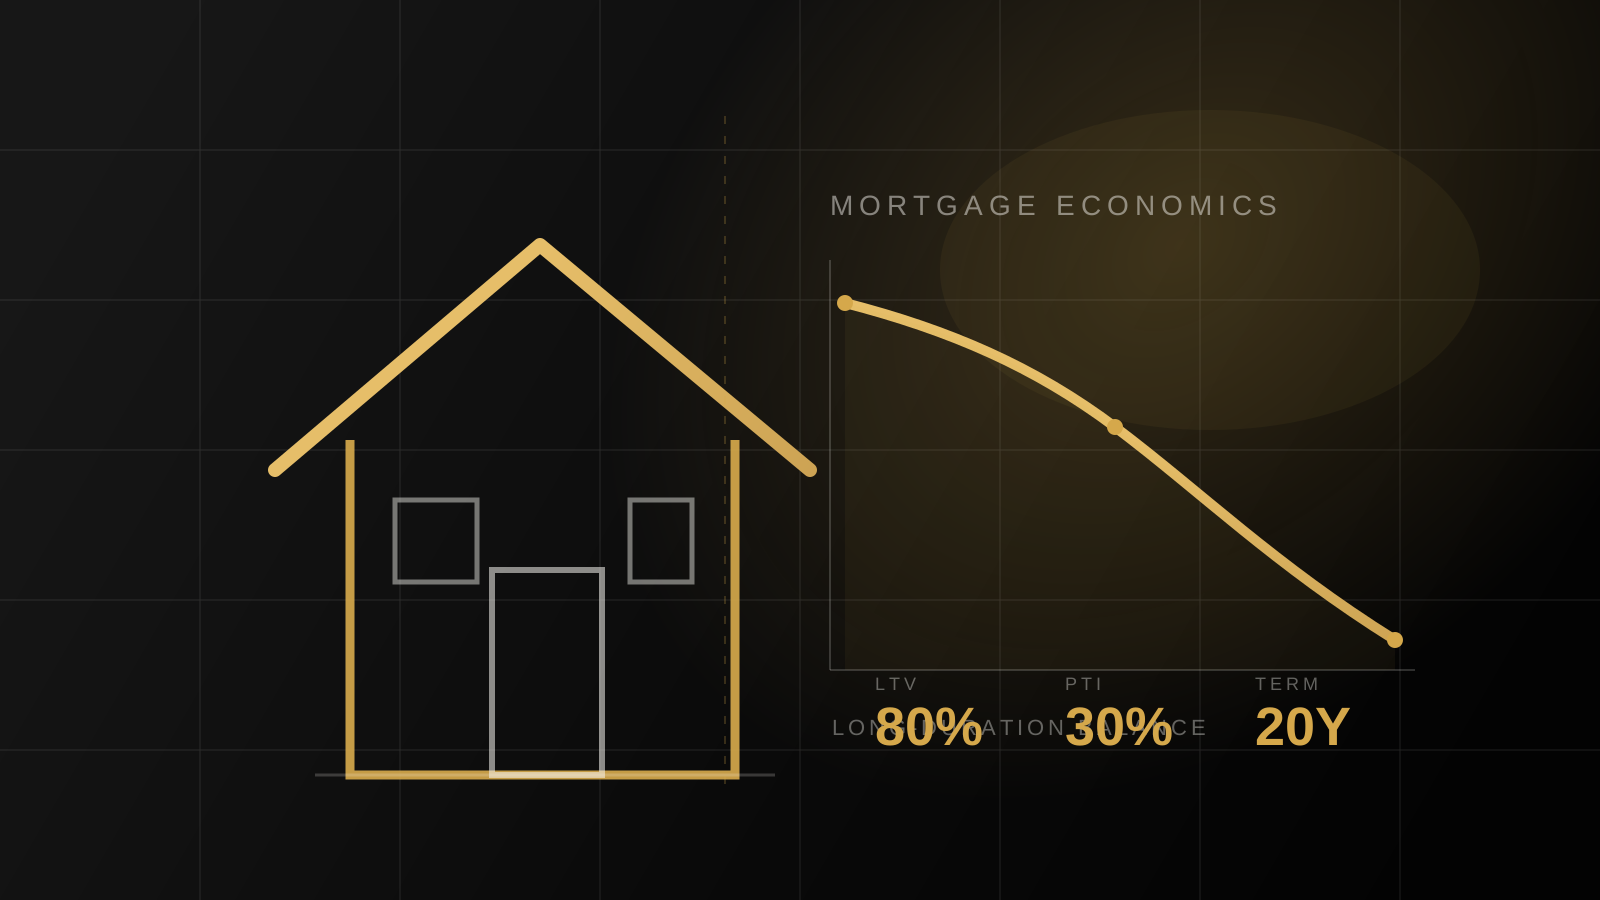
The nine models name it, and it is a different one in each product. In microcredit it is the freed hours that are never captured. In cards, the size of the issued base. In vehicle finance, affordability read on its own. In mortgage, PTI and turnaround time.
All four sit on almost every institution’s dashboard today. None of the four changes the P&L on its own.
A lever is not a benefit on its own. All nine models demand the same chain: decision, operating variable, P&L line. And all of them stop before tax, because that is where what management can redesign ends.
A rail is the infrastructure money moves over: Pix in Brazil, SPEI in Mexico, Bre-B in Colombia, account-to-account transfers in Chile, interoperable wallets in Peru. Each country built its own, and each is faster, cheaper and more interoperable than the last.
Which is exactly why charging for access to the rail no longer sustains a price. The strategic unit is neither the transaction nor the rail: it is the flow — who pays whom, why the money moves, and how urgent delivery is. This model opens the section because it settles that distinction before anything is compared.
THE MAP
And underneath the flow sits the topology: the components of the network, on both rails, with the businesses that live on top and what it costs to enter each segment. The map is common; the position is yours.
Each row is a model, ordered by how long the money stays exposed: from the millisecond decision to the thirty-year one. Open the one you want to verify.
The four metrics in the last column are the ones each model explicitly names as diagnostic: they inform, but they do not change the P&L on their own.
WHAT THE FOUR ROWS SAY TOGETHER
The metric that is watched measures activity. The lever that moves the result measures economics.
And the levers are of a different nature in each product — officer time, customer behaviour, exposure structure, contract duration. No single dashboard can govern all four.
A board reviewing four products with one set of indicators is measuring four different economies with the instrument of one. That is why there are four models and not one.
All four are decision models, not projections. They run across six markets with central-bank and supervisor references dated August 2026, keep those references separate from the editable illustrative assumptions, and stop at PBT: no tax, no PAT, no ROE.
ECONOMICS AND ARCHITECTURE
Three assets that are not products — and still carry a price.
All three open by naming a management error and correct it with a model that runs. Each one also declares what it does not incorporate.
APIs
APIs
Putting an institutional capability at a third party’s disposal, with a price.
Deciding by age and calendar instead of by the cost of keeping.
What becomes money
There is no price here: there is avoided cost. Keeping is a capital allocation decision.
The instrument
An S-curve with five inputs. Returns time to target, maximum speed in points per month, and what the last point costs.
The verdict
“If the cost of keeping is not measured, ‘doing nothing’ will almost always look cheaper than it really is.”
THE DOOR
Eight models measure a product.This one measures the structure.
Clients and products per employee is the only one of the nine that does not measure a product: it measures how much structure it takes to run them. That is why it is the door to the agents.
Volume grows. Headcount does not have to.
Leverage gap = growth in economic output − growth in operating structure
The distance between the two curves is the only measure that says whether something changed the economics or only changed the plumbing. When they run parallel, volume grew and economics did not.
An agent does not change a product’s economics directly. It changes how much structure it takes to run it. This gap is, literally, the variable an agent moves — and the same one that carries the Strategy thesis.
WHAT THE MODEL BRINGS
01
Five metrics in a ladder: scale density, load density, economic productivity, cost to serve and a quality guardrail.
02
Five comparability rules, because a bad denominator produces false productivity.
03
The explicit separation between what the filings support and what management still has to prove.
04
Public FY2025 evidence on Nu, Revolut, SoFi, Santander and Interactive Brokers.